Building a Smarter Tech Hedge

Over the past couple of weeks, we’ve discussed the benefits of using a smarter hedge basket vs. the standard and ubiquitous ETF hedges that most portfolio managers use to some extent. Most recently, we built a higher Volatility basket out of the SPY constituents, through which a manager could have made an incremental +5.68% return per year over the traditional SPY hedge.
With the major tech companies having reported or about to report, today we’ll turn our attention to the QQQ and XLK, to see if we can achieve the same level of success through our “smart hedge” methodology. We’ll also provide our weekly market and factor update.
Building a Smarter Tech Hedge
We now have Q3 results from ~30% of the Tech sector companies in the S&P 500. So far, total earnings for these companies have been down around -6.2% YoY, mostly due to drag from the semiconductor industry and anticipated weakness from a couple of the industry's heavy hitters. Today we'll focus on the two most common hedges that investors typically use to reduce their tech exposure - QQQ and XLK. For each of these ETFs, we used the same approach we used to create our SPY VOLHEDGE last week. As a reminder, our goal is to maximize exposure to Volatility - a negative premia factor that is down 32% over the last five years:
Volatility Factor Return (Market Neutral-Basket of high vol stocks vs. low vol stocks)

When an ETF hedge carries negative exposure to Volatility, the portfolio manager loses money by being short a losing factor.
Capturing the Volatility Premium — Methodology
Using only the constituents of the QQQ and XLK as the universe, we used our optimization engine to create a monthly rebalanced hedge basket with the following objectives and constraints:
- Objective: Maximize exposure to the Volatility factor
- Constraints:
- Maintain all other factor exposures as close as possible to the original QQQ or XLK exposures
- Portfolio turnover <= 10% on every monthly rebalancing
PowerShares QQQ vs. QQQHEDGE
The QQQ represents the NASDAQ 100, which is generally more internet software and services focused. Roughly 12% of the QQQ AUM is currently tied up in short interest, so we know that a lot of investors are using it as a hedge for their tech books, or their broader books (since the US market is so tech-heavy).
The QQQHEDGE basket that we constructed has on average 53 securities over the past five years vs. the QQQ’s 103, but is far more evenly distributed in weights of the securities in the basket. Here are the top 10 constituents of each:

Additionally, here’s what the Min-Max concentration looked like for each over the last five years:
QQQ: 0.06% - 11.67%
QQQHEDGE: 0.06% - 2.61%
Comparing Factor Exposures: QQQHEDGE vs. QQQ

As we can see, some factors remained constant, while others were impacted. The QQQHEDGE basket is far more underweight exposure to Exchange Rate Sensitivity and Size, and overweight exposure to Liquidity. For Volatility, our target factor, exposure was increased by +0.44 (from -0.12 to 0.32), which is exactly what we want to see.
Cumulative Performance: QQQHEDGE vs. QQQ (10/31/14 - 10/31/19)

Over the past five years, the QQQ was up 109.27% vs. QQQHEDGE, which was up +55.12% during that time. In other words, if you had shorted the QQQHEDGE basket instead of the QQQ, you would have made an incremental 54.15%, or 10.83% per year!
TECHNOLOGY SELECT SECTOR SPDR (XLK) vs. XLKHEDGE
We repeated the same exercise with the XLK, another popular tech hedge, which a bit more software, tech hardware, and chip-heavy compared to the QQQ. The resulting XLKHEDGE basket had 34 positions on average over the last five years, while the XLK had 68. Again, our hedge basket has a much more even distribution than the base ETF.
Here are the top 10 constituents of each:

Min-Max Concentration over the last five years:
XLK: 0.07% - 19.46%
XLKHEDGE: 1.87% - 3.4%
Comparing Factor Exposures: XLKHEDGE vs. XLK
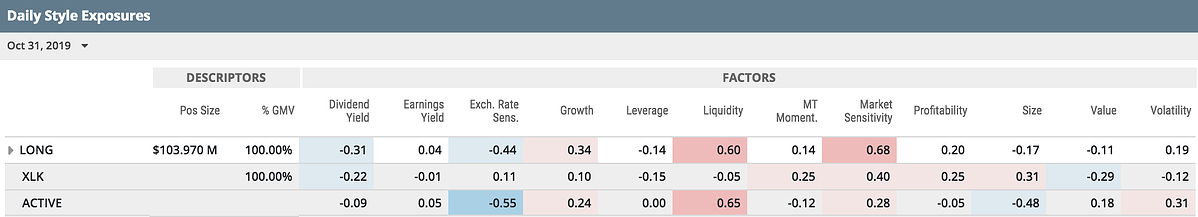
We saw a replication of many of the results from the QQQHEDGE. The XLKHEDGE was underweight the XLK for Exchange Rate Sensitivity and Size, and we were able to increase Volatility exposure by +0.31 (from -0.12 to 0.19).
Cumulative Performance: XLKHEDGE vs. XLK (10/31/14 - 10/31/19)

Over the past five years, the XLK was up 129.64% vs. XLKHEDGE, which was up +89.36% during that time. Because these are short instruments, a portfolio manager would have made an incremental +40.28% in return by using the XLKHEDGE, or +8.07% per year.
Through our findings, it’s clear that our optimization methodology can help any investor using ETFs as a market or sector exposure hedge.
US Market

- The market closed sharply higher on Friday (not captured in above chart), with the S&P 500 and NASDAQ hitting new records, based on a strong jobs report.
- The US created 128k new jobs in October, vs. economist consensus estimates of 75k. Unemployment ticked up to 3.6%, in line with expectations. The government also revised up the jobs reports for August and September by 95k.
- On Wednesday, the government reported that GDP grew at a 1.9% annual pace in 3Q, slightly down from 2% growth in the spring.
- In a widely expected move, the Fed cut rates by another 25bps, to a range of 1.5% - 1.75%.
- The latest ISM manufacturing activity index came in at 48.3% in October, below expectations for a 49% reading, but higher than September’s 47.8%. Any reading below 50% indicates contraction.
Factor Update - US Model

- Momentum was this week’s biggest winner, as it has rapidly reverted from being nearly 3 standard deviations below the mean at the end of September.
- Growth also saw a big gain this week, surging out of Oversold territory with a +0.36 SD move.
- Earnings Yield continued to climb higher into Overbought space, now sitting at +1.31 SD above the mean.
- Market Sensitivity and Volatility both continued see positive gains, with Market Sensitivity earnings an Overbought designation at +1.05 SD above the mean.
- The rally in Size appears to be over, as it ended the week where it started at +1.02 SD above the mean.
- Value continued to fall away from its recent peak of +2 SD above the mean (9/30) and looks poised to cross back into Neutral territory.
- Profitability was again the biggest loser, as it is now nearing the mean.
- US Total Risk (using the Russell 3000 as proxy) saw a slight decrease of 18 bps.
Factor Update - Worldwide Model

- Momentum was the biggest winner internationally as well, as it continued to revert back to the mean after bottoming out at -2.51 SD below the mean on 9/23.
- Volatility also continued to see strength on a normalized basis, up +0.23 standard deviations and approaching Overbought territory.
- Earnings Yield started to tick down and is close to shedding its Extremely Overbought label.
- Exchange Rate Sensitivity was again the biggest loser, as it has plummeted towards Oversold space.
- Global Risk (using the ACWI as proxy) also declined 15bps.
Regards,
Omer


