Impacting Change Through Socially Responsible Investing

This past week we have been both outraged and heart-broken watching protests against racial injustice unfold across the country. We at Omega Point stand in full solidarity with the Black community to fight systemic racism. We pledge to do our part to listen and to learn more about how we can impact change using the resources and tools available to us within the investment management industry.
We believe that the investment community is in an especially unique position to enact change by choosing where we deploy our capital. As many of you know, the use of ESG or Environmental, Social, and Governance factors in investing is not a new practice in our industry. Over the last several decades, funds have shifted their investment practices to include investing in green/environmental companies, however, fewer funds have prioritized social factors. The ‘S’ factor scores a company’s diversity, human labor practices, community facing programs, compensation and more. A company’s ‘S“ factor score is also significant in determining how effective it will be impacting widespread social change.
Over the next several weeks, Factor Spotlight will focus on examining Social factors and demonstrate, with both external and direct empirical research that companies that score higher on ‘S’ factors are-on average-better performers over the long term than companies with poor ‘S’ scores. We think that this is a powerful signal to the investment management community as it represents a positive feedback loop:
- Investors allocate capital to companies with strong social practices THUS allowing those companies to invest in programs and movements such as Black Lives Matter AND drive higher returns for those investors.
We believe it is imperative that the investment industry unite in driving broader social change, and we stand by you to help implement socially responsible practices into your investment process.
What Are The Social Factors?
Our data partner for ESG factors is OWL Analytics, a data company that aggregates and optimizes over 100 million ESG data points for 25,000+ companies across 400+ sources of ESG research. This broad analytical foundation eliminates much of the subjectivity inherent in tracking non-standardized investment themes. The purpose of measuring companies against these ESG factors is to quantify how well a company manages their material risks and opportunities relating to their impact on the environment, their stakeholder relationships, and their internal governance procedures.

OWL organizes the ‘S’ in ESG into 6 factors bucketed into 2 broad categories that are aligned with the United Nations Principles for Responsible Investment (UN PRI) sustainable development goals.:
1. Social - Employees
- Compensation & Satisfaction
- Diversity & Rights
- Education & Work Conditions
2. Social - Citizens
- Community & Charity
- Human Rights
- Sustainability Integration
Measuring the Investment Importance of Social Factors
Last summer, we published a Factor Spotlight on Socially Conscious investing. To summarize this piece, we found that our portfolios built to isolate the Social factors ALLshowed positive performance between Jan 2015 and June 2019. These portfolios were designed as long/short market and sector neutral with a pure focus on the Social factors. Below is a summary table showing this insight.

We found this to be an encouraging piece of evidence. In the following weeks we will dive deeper into each of these factors and also highlight recent performance.
The Multi-Trillion Dollar Question - Can The Investment Community Unite For Social Change?
This week, we were encouraged to see bold actions to the Black Lives Matter movement taken by many companies, including Bank of America and Nike. As a community that invests trillions of dollars each year into the financial markets, we can make an impact of immense proportions not just this year, but every year.
Omega Point looks forward to partnering with many of you so that we may all realize this vision.
US & Global Market Summary
US Market: 6/01/20 - 6/05/20
- The market continued to climb, with the S&P 500 hitting its highest level since Feb 25.
- Friday’s rally was stoked by the May jobs report, which surprised investors with a 2.5 million increase in non-farm payrolls and decline in unemployment to 13.3% (from 14.7%). Consensus expectations were for a May unemployment rate of 19%, so this report was a bit of a shock to most.
- Leisure and hospitality comprised nearly half the jobs gained.
- There are some questions around the specifics of the report, including BLS’ assertion that the rate would have been ~3% higher had respondents filled out their surveys accurately.
- The US continued to lead the world in COVID-19 cases (1.89 million on Friday) and deaths (108,708).
Factor Update: Axioma US Equity Risk Model (AXUS4-MH)

- The rally in Value continued, as it climbed by nearly 0.5 a standard deviation and now sits within knocking distance of Extremely Overbought territory.
- Size bounced back from a low of -3.17 SD below the mean on 6/3, and is digging its way back towards the mean (still Extremely Oversold).
- Earnings Yield saw a slight positive move on a normalized basis, as it slowly headed towards +2 SD above the mean.
- Profitability continued to rebound, emerging from the depths of Extremely Oversold space .Recall this factor reached a peak of +6.47 SD above the mean on 3/20.
- Volatility retained its Extremely Overbought label, while Market Sensitivity exited Extremely Overbought territory for the moment.
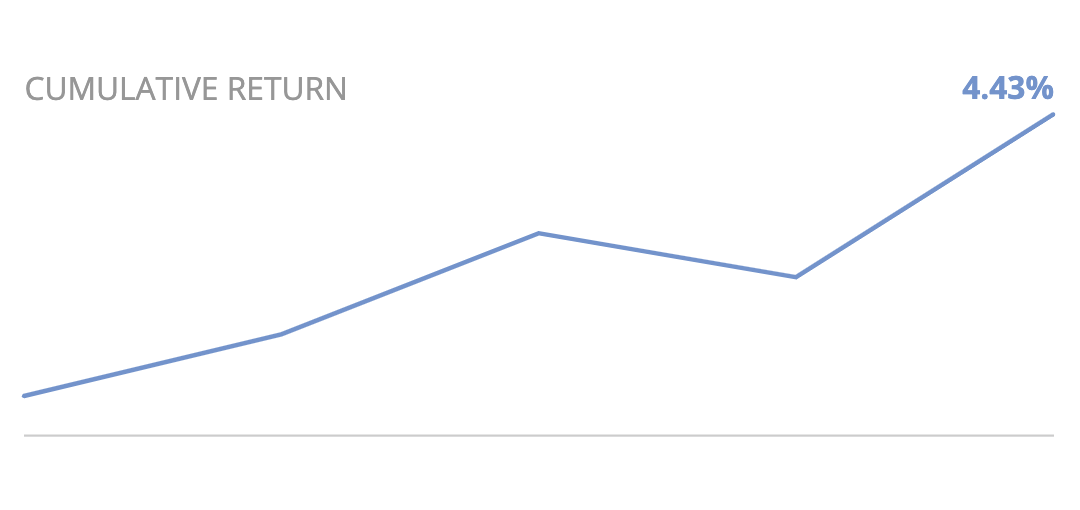
- Momentum seemingly fell off a table on a cumulative basis (see below chart of YTD return), resulting in a sizable gap down in our normalized framework:

- Meanwhile, Growth continued to fall back towards the mean, leaving Overbought territory and now sitting at +0.74 SD above the mean.
- US Total Risk (using the Russell 3000 as proxy) increased by 27bps.
Factor Update: Axioma Worldwide Equity Risk Model (AXWW4-MH)

- The global rally in Size continued, as it left Extremely Oversold space after seeing a +0.66 SD move over the week.
- Similar to the US, Value saw a strong positive move on a normalized basis, as it headed towards Extremely Overbought territory.
- Exchange Rate Sensitivity remains an Overbought factor as it continued to rise from a trough of -4.9 SD below the mean on 3/31.
- Profitability ended its losing streak last week, and is climbing back towards the mean.
- Market Sensitivity and Volatility both saw slight declines and are both poised on the brink of leaving Extremely Overbought territory.
- Just like in the US, Growth took another tumble, shedding its Overbought label as it fell back towards the mean.
- Momentum was the week’s biggest loser, falling over one full standard deviation and earning an Extremely Oversold label at -2.37 SD below the mean. Here’s what YTD cumulative return looks like for this factor, which we will continue to monitor:

- Global Risk (using the ACWI as proxy) increased by 39bps, in line with the US.
Regards,
Omer


