Where’s the Alpha? - 2021 Edition

The transition from one year into the next offers opportunities for reflection and learning. As we mark the end of a year filled with tumult and tribulation, we can use past patterns to help inform where we may find new successes in the future. Over the next few weeks, we’ll be looking back to 2021 to help understand what the alpha opportunity looked like for fundamental investors and help inform how to better identify alpha opportunities in 2022.
Defining Alpha-Driven Stocks
We’ll be borrowing from a prior methodology we’ve employed to identify alpha-driven names to kick off our analysis.An “alpha-driven” stock has more than 67% of its predicted volatility driven by idiosyncratic risk. Conversely, a “factor-driven” stock has more than 67% of its predicted volatility caused by systematic risk factors. Therefore, we use a risk model to calculate the predicted volatility and the idiosyncratic vs. factor breakdown.
To ensure we have a complete picture, we’ll leverage two risk models and define the alpha-driven names as the ones where both risk models agree that 67% or more of the predicted volatility is idiosyncratic (or systematic for factor-driven names). For this analysis, we will use the Axioma US 4 Medium-Horizon (“Axioma US”) and the Barra US Total Market Equity Model for Long-Term Investors (“Barra US”) risk models.
When we applied this framework to securities in the Russell 3000 from December 2020 to December 2021, we found that the Axioma US and Barra US models agree on which names are alpha-driven, factor-driven, and neutral (i.e., neither alpha-driven nor factor-driven) 76% of the time, on average.

We focused on the names where the two models agree and segmented these names into three groups to form the “true” alpha-driven, factor-driven, and neutral securities.
Was there Alpha Opportunity in 2021?
Now that we have our alpha-driven, factor-driven, and neutral groups, we can analyze these groups throughout 2021 to understand how much alpha opportunity existed through the eyes of the risk models.

While approximately 50% of the Russell 3000 universe was in the neutral group throughout 2021, there was still a meaningful proportion - about 20% - of the universe falling into the alpha-driven group. Despite the turbulent market events of 2021, we didn’t see much fluctuation in the size of each of the groups throughout the year. This result is a sharp contrast to what we saw in 2020, where the proportion of alpha-driven names dropped significantly during the March 2021 downturn. Though the 2021 alpha-driven group was much more consistent than we saw in 2020, the proportion of alpha-driven names is still nowhere near the levels seen in 2018 and 2019, which was in the 40-60% range.
Alpha-Driven & Factor-Driven Names Have High Sector Concentration
Interesting trends start to emerge when we dive into the DNA of the alpha-driven and factor-driven groups. First, a sector breakdown highlights heavy concentration across groups. The chart below shows the average percent of each group that belongs to each sector.

Over 50% of the alpha-driven names are in the Health Care sector, and the next largest sector within this group is Information Technology, which makes up 13% of the alpha-driven group. However, the sector picture is quite different for the factor-driven group. Here, Financials make up almost 60% of the group, and conversely to the alpha-driven names, Health Care has no representation in the factor-driven group.
What Do Alpha-Driven Names Look Like Going into 2022?
The above analysis has set the stage for us to recognize better what an alpha-driven stock could look like going into 2022. We’ve found that in 2021, about 20% of the US market had a meaningful alpha opportunity. Much of this was concentrated in the Health Care sector. However, there are many other fundamental, technical, macro, and positioning characteristics that can provide further insight into the DNA of alpha-driven names.
In next week’s Factor Spotlight, we’ll extend our analysis to include these other factors and further dissect the characteristics of the alpha-driven and factor-driven names.
US & Global Market Summary
US Market: 12/27/21 - 12/31/21

- Markets moved higher this week, even as reports of rising COVID-19 cases coninued to pour in across the globe.
- The S&P 500 saw a 27% advance for 2021 and has hit 70 highs, its third straight year of double-digit gains.
- The Dow Jones Industrial Average and Nasdaq Composite have gained 19% and 21%, respectively, this year, sending the major indexes to their best three-year performance since 1999.
- U.S. workers filing for jobless aid remained near a 50-year low amid a tight labor market.
- The US hit a seven-day average of 265,427 new Covid-19 cases on Tuesday, blowing past the country's previous record of about 252,000 daily cases, reported nearly a year ago on January 11.
Normalized Factor Returns: Axioma US Equity Risk Model (AXUS4-MH)

- Market Sensitivity jumped after several weeks of bottom-two finishes and places at the top of this week’s U.S. factor leaderboard.
- Value continues to build on recent strength to cross into positive territory and secure this week’s runner-up spot.
- Volatility broke out of a ten-week slide and now sits at -0.79 SD below the mean.
- Medium-Term Momentum continues to fall as it approaches oversold status.
- Earnings Yield tumbled following an 11-week move upward and slid further from extremely overbought terrain to sit at +1.39 SD above the mean.
- Size showed vulnerability after a recent upward tear and crossed the threshold into negative territory.
- Profitability continues its pre-holiday slide to dip into negative territory and secure this week’s bottom-placed finish.
- US Total Risk fell by 0.10% this week.
Normalized Factor Returns: Axioma Worldwide Equity Risk Model (AXWW4-MH)
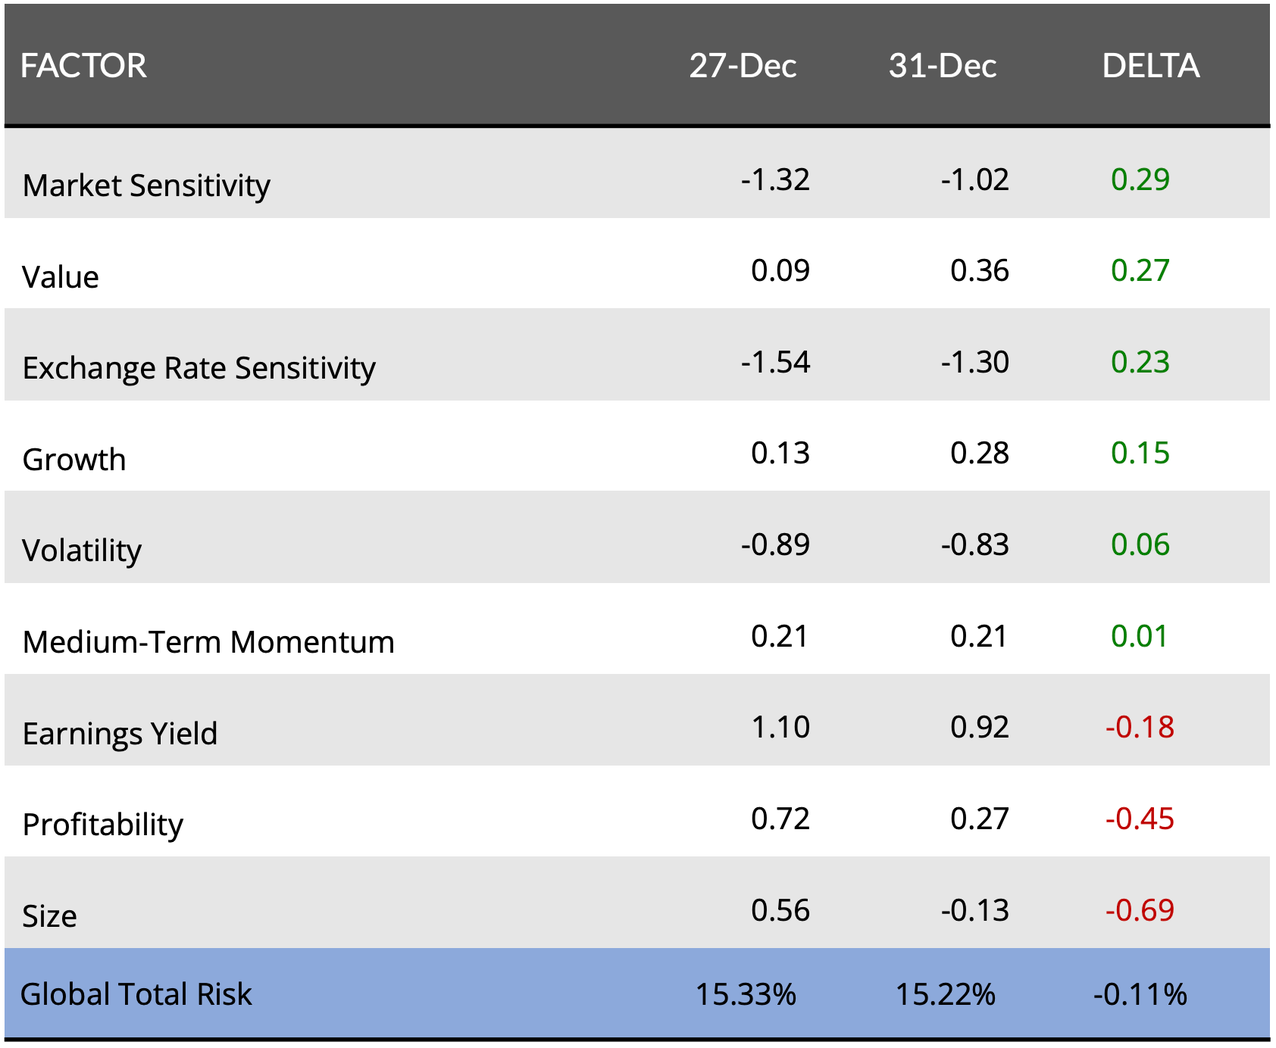
- Market Sensitivity finishes atop the global factor leaderboard to sit on the doorstep of finally exiting oversold territory.
- Value continues to show strength following consecutive top-two finishes as it marches through positive terrain.
- Exchange Rate Sensitivity reversed its several-week slide and finishes the week at -1.30 SD below the mean.
- Profitability slid hard for the third consecutive week as it approaches the mean.
- Size plunged this week to finish at the bottom of the global leaderboard and crossed into negative territory.
- Global Total Risk fell by 0.11% this week.
Regards,
Alyx


